This site uses cookies to improve your experience. To help us insure we adhere to various privacy regulations, please select your country/region of residence. If you do not select a country, we will assume you are from the United States. Select your Cookie Settings or view our Privacy Policy and Terms of Use.
Cookie Settings
Cookies and similar technologies are used on this website for proper function of the website, for tracking performance analytics and for marketing purposes. We and some of our third-party providers may use cookie data for various purposes. Please review the cookie settings below and choose your preference.
Used for the proper function of the website
Used for monitoring website traffic and interactions
Cookie Settings
Cookies and similar technologies are used on this website for proper function of the website, for tracking performance analytics and for marketing purposes. We and some of our third-party providers may use cookie data for various purposes. Please review the cookie settings below and choose your preference.
Strictly Necessary: Used for the proper function of the website
Performance/Analytics: Used for monitoring website traffic and interactions
While top-line performance advances, growing operating expenses are projected to limit profit growth over the remainder of the year. The occupancy projection for this year was lowered 0.2% from the previous forecast, but projections for averagedailyrate (ADR) and revenue per available room (RevPAR) were lifted 1.5%
Sustainability is increasingly a major concern for developers and operators due to rising utility costs of hotels, and the global investment market’s focus on ESG for all real estate asset classes. In addition, the new wave of supply is anticipated to play a role in driving rate performance over the next two years.
CBRE’s market analysis found that boutique properties have outperformed ‘big box’ international hotels on occupancy levels, AverageDailyRate (ADR) and Revenue Per Available Room (RevPar) since the onset of the pandemic in 2020.
Brent Hill, Tourism Fiji Leading figures from major hotel operators will take to the stage including Accor Chief Operating Officer PME – Pacific, Adrian Williams, and Outrigger Hospitality Group, President and CEO, Jeff Wagoner, alongside key owners such as Crowne Plaza Fiji Nadi Bay Resort and Spa Owner, Jay Singh.
While top-line performance advances, growing operating expenses are projected to limit profit growth over the remainder of the year. The occupancy projection for this year was lowered 0.2 percent from the previous forecast, but projections for averagedailyrate (ADR) and revenue per available room (RevPAR) were lifted 1.5
Lyf Schönbrunn Vienna “Ascott operates with a flex-hybrid model that gives opportunistic agility across our serviced residences, co-living properties and hotels,” Goh said. New locations Lyf is currently present in 21 cities globally, with over 5,500 units both operating and in the pipeline.
In short, they largely do, which could spell another strong year for Southeast Asia’s hotel industry from both an occupancy and investment point of view. Inbound capital is originating in the Asia region but is also coming from Middle Eastern and European owner-operators and HWNI/corporate buyers looking at strategic investment opportunities.
Many operators still run standalone systems that dont share guest data between properties. RMS focused on Tier 1 and Tier 2 cities like New Delhi (NCR), Mumbai, Bangalore and Pune, where the averagedailyrate sits between 5,000 and 20,000 and occupancyrates can reach 70%.
For example, a 100 room hotel property which has only 90 rooms operating, would need to take 90 as the base for applying a RevPAR formula. It is also beneficial in predicting the averagerate at which available rooms are being let out by your hotel, thereby providing a valuable understanding of your hotel’s operations.
With consumer behaviours evolving, and the lines between tech platforms, marketing, and operations blurring, a modern strategy goes far beyond just listing rooms on online travel agents (OTAs). A drop below 30% occupancy? Your rates drop automatically to drive last-minute bookings, across all OTAs. No more repetition.
Strong operating performance and investor confidence contributed to the sectors continued momentum, particularly in metropolitan markets. Overall occupancy levels remained flat, increasing by just 0.1 Growth was largely driven by higher AverageDailyRates (ADR), which outpaced inflation. per cent year-over-year.
To assess the impact of hotel spa departments on recent hotel operations, we analyzed the performance of 139 U.S. hotels that operate a spa and participated in CBREs Trends survey each year from 2018 through 2022. In 2022, these 139 hotels averaged 63.5% occupancy, along with a $426.78 averagedailyrate (ADR).
The results reflect the group’s strong financial performance across most key markets, particularly its hotel operations in Europe and Thailand where core revenue grew 25% and 65% respectively. “We Revenue was up 25% on 2022 figures with topline total system sales reaching THB 157 billion (approx.
Sydney’s hotel market is the top performer nationally with occupancy above 75%, an averagedailyrate (ADR) above AU$300 and revenue per available room (RevPAR) above AU$200, according to STR and Colliers. Brisbane – the only market in Australia where occupancies are trending higher than 2019 – is another top performer.
Notable growth rates include a 9.3% Market level hotel occupancyrates, averagedailyrates (ADR), and revenue per available room (RevPAR) across various regions are also detailed in the report. It offers actionable insights and data-driven strategies to navigate the dynamic market landscape.
Skift Take: India's hotel industry has gaps and enough potential to warrant significant growth over the next few years. But whether the players will be able to capitalize is a different question altogether. Bulbul Dhawan Read the Complete Story On Skift
What drives more value to the business, ADR, averagedailyrate, or occupancy? So what is it, Occupancy or Average Room Rate (ARR)? For a more full picture including operational costs like cleaning into the mix, the KPI GOPPAR is used. It stands for Gross Operating Profit Per Available Room.
SO/ Maldives is a multi-million international joint venture project developed in partnership with leading business conglomerate Wai Eco World Developer (WEWD) and operated by the successful Ennismore team – leaders in operating hotels and building brands.
Offering high-tech wellness amenities can increase averagedailyrates (ADR), boost occupancyrates, and create positive word-of-mouth that drives long-term growth. Additionally, properties that invest in wellness innovations like RLT often see higher guest satisfaction scores and increased loyalty.
What is a hotel operations manager? A hotel operations manager is responsible for overseeing the day-to-day functions of a hotel, ensuring seamless coordination between departments, maintaining high service standards, and optimising overall efficiency. trillion in 2023, the demand for skilled operations managers has never been higher.
With rising inflation across the world, it’s not surprising that the averagedailyrate has risen, but it didn’t deter reservations in 2023. With rising inflation across the world, it’s not surprising that the averagedailyrate has risen, but it didn’t deter reservations in 2023.
With that in mind, it’s an opportune time for hotel operators to reassess their revenue strategies to capitalise on the influx of travellers. Historically, hotel performance has been measured by room-based metrics such as Revenue per Available Room (RevPAR), AverageDailyRate (ADR), and occupancy.
The right sales tactics can help increase revenue, boost occupancyrates , and ensure guests have a positive experience. A loyalty program can encourage guests to keep coming back, which boosts your occupancyrate. If they lower their rates, you might need to adjust yours to stay competitive.
It is a key indicator of a hotel’s performance as it measures both occupancyrates as well as averagedaily room rates. RevPAR = AverageDailyRate (ADR) x OccupancyRate (%). Your ADR might be high but so should your occupancy – and vice versa.
What drives more value to the business, ADR, averagedailyrate, or occupancy? Occupancy or ADR? So what is it, Occupancy or Average Room Rate (ARR)? For a more full picture including operational costs like cleaning into the mix, the KPI GOPPAR is used. Article Summary: Which is it?
The Veriu Group is making its mark in Australia’s apartment hotel landscape with over 3,000 rooms operating across 21 sites and a further 17 sites in development across both the Veriu Hotels and Suites and Punthill Apartment Hotels brands. This has, in turn, created enormous opportunity for hotel conversion.
The data, produced by Hotstats and analysed by RSM UK, shows that averagedailyrates (ADRs) of occupied rooms have increased from £121.74 (January) to £128.94 (February) in the UK and from £185.43 UK hotel occupancyrates were up from 56.1 Occupancy levels are yet to reach pre-pandemic volumes of 69.6
Efficient hotels use systems and procedures to streamline operations. That’s where hotel operational efficiency comes in. When you have lower operating costs, you can more comfortably offer more competitive rates, winning business and growing your market share. Creating an efficient hotel is simply good business.
As labor shortages persist and travelers become increasingly price-sensitive, 2025 is emerging as the year of optimizing performance with hostel operators under pressure to improve efficiency and profitability. Key findings from the 2025 report include: Dorms saw year-over-year occupancy growth in 2024, while private rooms dropped.
With a focus on hotel and resort operations and investment, AHICE provides a platform for industry leaders to connect, learn, and collaborate. “The launch of AHICE Far East Asia marks a significant milestone for the Japanese hotel industry,” said James Wilkinson, AHICE Group President.
Focusing on the Wrong Metrics We agree on the importance of occupancyrates, understanding demand, and the need to track your competitors pricing, but the key to true success is revenue management is to analyze and understand ADR (AverageDailyRate) while improving the occupancy.
Hotel accounting is a system designed to track and manage a hotel’s finances – income, expenses and financial performance – to ensure profitability, compliance and operational efficiency. It breaks down cash flows into operations, investments and financing activities, which can help to assess liquidity and financial health.
With connections to 400+ airlines and 50+ rail, cruise and ferry operators, Amadeus is a gateway to new revenue opportunities. For hotels, its a chance to have their inventory advertised to thousands of travel providers such as traditional travel agents, tour operators, or package sellers. What is Amadeus GDS used for?
Additional data from SiteMinder’s Hotel Booking Trends indicated that the average length of stay is also on the rise, with 2022 recording longer stays than previous years. This was particularly true for Spain in summer, which had the longest average stay length in August.
It is an essential practice for hoteliers and revenue managers to optimize pricing, maximize occupancy, and enhance overall profitability. It involves forecasting key metrics such as demand, occupancy, averagedailyrate, and RevPAR (revenue per available room). What is Hotel Forecasting?
An RMS should provide detailed insights into key performance metrics such as Room Revenue Per Available Room (RevPAR), AverageDailyRate (ADR), occupancyrates, booking pace, and revenue forecasts. Scalability and Flexibility: As your hotel grows, so should your RMS.
EBITDAR (Earnings Before Interest, Taxes, Depreciation, Amortization, and Restructuring/Rent) is a profit metric that excludes costs not directly related to operational performance. EBITDAR is calculated using details from the income statement, which presents a company’s revenues and operating expenses over a specific period.
Running a hotel isn't just about providing a great guest experience; it's also about understanding the numbers behind your operations. By monitoring the right KPIs for hotel staff and operations, you can identify strengths, uncover areas for improvement, and ultimately boost your hotel's success.
Are you ready to transform your hotel operations and stay ahead in this competitive marketplace? Meanwhile, nationwide hotel occupancy reached 67.5% in 2023/24—the highest in a decade—with averagedailyrates hitting an all-time high of ₹8,055. What does this mean for you as a new hotelier ?
These metrics encompass a wide range of areas, from financial figures like revenue per available room (RevPAR) and averagedailyrate (ADR) to operational aspects such as occupancyrates and guest satisfaction scores. It can be calculated by multiplying your averagedailyrate by your occupancyrate.
In an increasingly competitive market, evaluating performance through accurate hotel KPIs allows hoteliers to make proactive decisions that directly influence occupancy, guest satisfaction, and profitability. For example, a hotel with 100 operational rooms in a 30-day month has 3,000 available room nights.
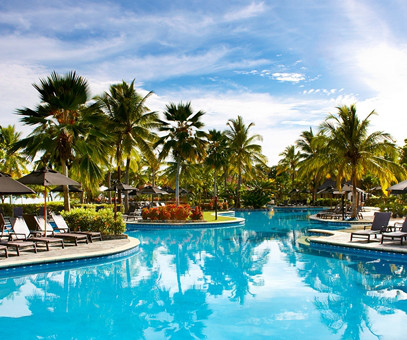
A bumper crowd of over 330 leading owners, investors, operators, suppliers and advisors were at the Sofitel Fiji Resort and Spa this week (Jul 3-4) for the 2024 AHICE Fiji Islands Investment in Tourism Summit , where record performance numbers were the talk of the major conference. Then again, it’s even hotter than you thought.
As a hotelier, monitoring your hotel's performance is paramount to ensuring smooth operations and maximizing revenue. In this context, reports are critical as they provide key insights into your hotel's operations, from housekeeping to finance, marketing, and guest preferences. Benefits of these reports Here they are.
Understanding future demand trends, their causes, and the guest segments driving them can help hotel revenue managers adjust room rates to boost occupancy and sales. The bold line represents the averageoccupancyrate for the competitive set. Each point on the chart shows a specific day’s occupancy for the hotel.
We organize all of the trending information in your field so you don't have to. Join 19,000+ users and stay up to date on the latest articles your peers are reading.
You know about us, now we want to get to know you!
Let's personalize your content
Let's get even more personalized
We recognize your account from another site in our network, please click 'Send Email' below to continue with verifying your account and setting a password.


Let's personalize your content